
In the era of big data, data has become an important asset for enterprises and individuals, and how to extract useful information and tap potential value from massive data has become a concern for every organization and individual. As an intuitive and efficient way to display data, big visualization screen is gradually becoming the first choice of enterprises and individuals.
Below you will learn about the design and implementation process of visualization screen, and how to use visualization screen to better display data and enhance the value of data.
The design principles of visualization screen
In practice, we need to follow certain design principles to ensure the effect and quality of visualization screen. The following are four principles to follow when designing a large visualization screen:
1. clear objectives: in the design of visualization screen, first of all, to clarify the design objectives. Clear objectives is the premise of the design, which needs to be considered from the following aspects:
Theme of the data display: the need to display the data categories, data sources and other information.
The object of data display: for different user groups, design different display methods.
The purpose of data display: whether it is necessary to display in real time, whether it is necessary to support data interaction and so on.

2. Interface Layout: Interface layout is the basis of design, and the following aspects need to be considered comprehensively:
Interface style: choose a suitable interface style according to the corporate culture, brand image and other factors.
Interface structure: design a reasonable layout structure, including header, content area, bottom, etc.
Interface navigation: provide a clear navigation structure to facilitate users to quickly find the information they need.
3. Data visualization: Data visualization is the core of the design, which mainly involves the following aspects:
Data chart type: choose the appropriate chart type according to the data characteristics and display requirements.
Data chart style: set the appropriate colors, fonts and other styles to enhance the readability of the data.
Data Chart Interaction: Design interaction functions according to the requirements, such as clicking, sliding, etc., to improve the explorability of the data.
4. Responsive design: Responsive design is an extension of design, and the following aspects need to be considered:
Device compatibility: Ensure that the visualization screen is displayed consistently on different devices.
Browser compatibility: Ensure that the visualization screen displays well in mainstream browsers.
Screen adaptation: automatically adjust the layout and style according to the screen size and resolution.

The visualization of the large screen technology selection
before the realization of the visualization of the large screen, we need to choose the appropriate technology stack. The following are several common technology selection:
1. Front-end technology: mainly including HTML, CSS and JavaScript, is the basis of the visualization of the big screen.
HTML: responsible for the structure of the page, you can use HTML5 semantic tags to improve the readability of the code.
CSS: responsible for the page style, you can use CSS preprocessor (such as Sass, Less) to improve programming efficiency.
JavaScript: responsible for the interaction of the page, you can use the front-end framework (such as React, Vue) to improve development efficiency.
2. data visualization libraries: responsible for converting data into charts, common libraries are:
ECharts: Baidu open source data visualization library , providing a rich set of chart types and features .
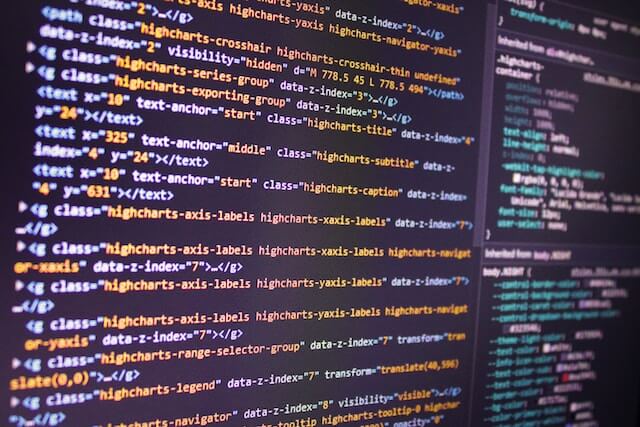
Highcharts: powerful commercial data visualization library , support for a variety of chart types and export functions .
D3.js: Web standards-based data visualization library , providing powerful data-driven document features .
3. back-end technology: responsible for data processing and storage, common technologies are:
Node.js: JavaScript runtime based on Chrome V8 engine, which can be used to build back-end services.
Python: simple and easy to read programming language, can be used for data processing and analysis.
Database: used to store data, common databases are MySQL, MongoDB, etc.
The visualization of the large screen to achieve the steps
1. Interface layout: Use HTML and CSS to build the page structure and style, you can refer to the following steps:
Use HTML5 semanticized tags to create the page structure, such as <header>, <section>, etc..
Write styles using CSS preprocessor to separate structure and style and improve code maintainability.
Use responsive design techniques such as media queries, raster systems, etc. to ensure that pages display consistently on different devices.
2. Data visualization: Use data visualization libraries to convert data into charts, you can refer to the following steps:
Choose a suitable data visualization library, such as ECharts, Highcharts, etc..
Use the API provided by the library to create a chart instance, set the chart type, style and other properties.
Bind the data to the chart instance to realize the dynamic display of data.
3. Data interaction: Use JavaScript to realize the interactive functions of the page, you can refer to the following steps:
Use native JavaScript or front-end framework to write the interaction logic.
Listen to user events, such as clicking, sliding, etc., to realize the interaction function.
Use AJAX or Fetch API to get back-end data to realize real-time data update.
4. Back-end services: Use back-end technology to process and store data, you can refer to the following steps:
Use programming languages such as Node.js, Python, etc. to build back-end services.
Use databases to store data, such as MySQL, MongoDB, etc.
Provide API interface for front-end to get data and realize real-time update of data.